Last year has elapsed at an unprecedented speed. Changes were being noticed on all fronts; they spared no one and set an even more competitive environment. Only those succeeded, who managed to keep up with the changes.
Well, marketing is never an exception. Some trends remain the same, such as that meaningful content marketing still represents the most intimate way to your customer’s hearts. Other trends alter just like that – pictures are new letters, videos are new chapters, memes are new jokes.
What remains on genuinely solid ground, though, is the ability to customize the message so each of your audiences can embrace it. And what’s more, the ability to reach the audience through the right channels.
Therefore, we’ve compiled a brief summary of some online marketing statistics for the year 2021. They confirm trends we witnessed before and enhance our knowledge.
Content Marketing
#1 Blogs are still among the primary three forms of media used in content strategies today.
#2 In the marketing industry, the top-performing articles are longreads (7000+ words). They drive 4x more traffic than articles of average length (900-1200 words).
#3 Articles with at least one image get four times more traffic and 1,5 times more backlinks.
#4 Articles that don’t contain a video get 92% less traffic and 24% less shares.
#5 45% of global internet users aged 25-34 listen to podcasts.
Social Media Marketing
#6 Roughly 36% of people get their news from Facebook regularly.
#7 Facebook stories have 300 million active users daily.
#8 Average user spends about 19 hours on the Facebook app each month.
#9 Square videos get a whopping 35% more views than landscape videos.
#10 The probability of watching a live stream on FB is 4 times higher than watching recorded videos.
#11 Instagram is the social channel with the second-highest ROI among marketers.
#12 Every month, 130 million Instagram users click on shopping posts.
#13 62% of users say they are more interested in a brand after seeing it in an Instagram story.
#14 About 81% of people use Instagram to research products and services.
#15 Instagram video ads receive 3x more engagement than image ads, by means of comments.
#21 89% of B2B marketers use LinkedIn for lead generation.
#22 There are more than 750 million LinkedIn users. Every 2 seconds a new member signs up.
#23 The average user spends 17 minutes on LinkedIn in a month. It’s significantly less than Facebook users, who spend about 27 minutes per day scrolling through the app.
#24 57% of all LinkedIn traffic is from mobile devices.
#25 Audiences exposed to brand and acquisition messages on LinkedIn are 6x more likely to convert.
Video Marketing
#26 67% of Millennials agree that they can find a YouTube video on anything they want to learn.
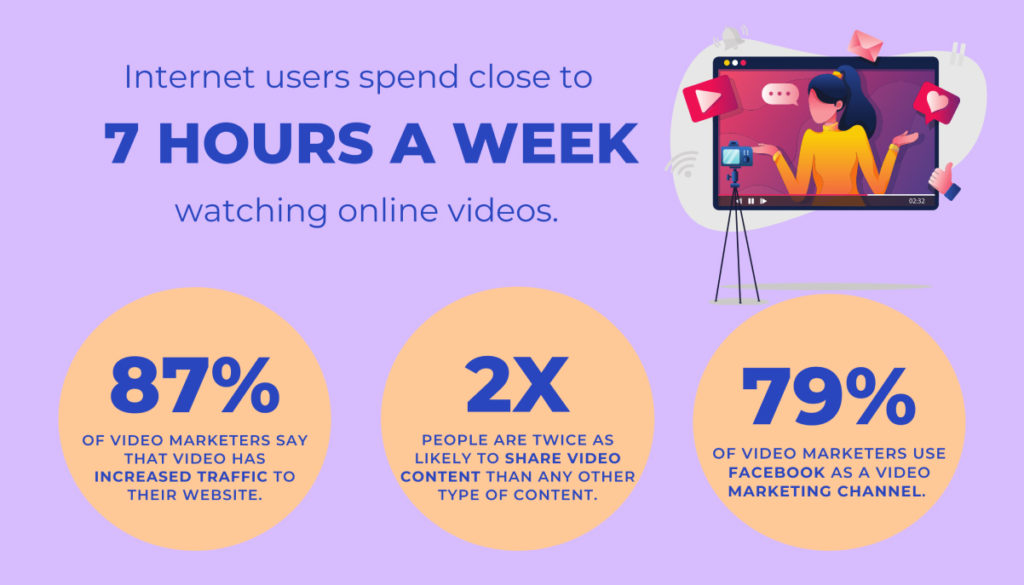
#27 87% of video marketers say that video has increased traffic to their website.
#28 People are twice as likely to share video content with their friends than any other type of content.
#29 79% of video marketers use FB as a video marketing channel.
#30 LinkedIn users are 20x more likely to re-share a video post.
Email Marketing
#31 For ten years in a row, email is the channel generating the highest ROI for marketers.
#32 40%of people 18 years old and under will always open an email on their mobile device first. This number drops with older generations. In comparison, just about 28% of people between the ages of 19 and 34, and only 8% of readers between 56 and 67 tend to open emails on their smartphones first.
#33 The average email click through rate is about 3%. Including a video in your email can boost CTRs up 65%.
#34 Emails with personalized subject lines are 26% more likely to be opened.
#35 Millennials may be the age group that uses email the most. The average millennial spends about 6,5 hours a day on email and even 40% of millennials check their work email in bed, before or after work.
SEO vs PPC
#36 65% of customers click on ads when purchasing.
#37 36% of searches have local intent.
#38 53% of paid clicks are from a mobile device.
#39 44% of people say they use ad blockers because they don’t want their online behaviour to be tracked.
#40 57% of marketing executives say on-page content development was the most effective SEO tactic.
FYI:
📲 On average, we check our phones every 5-7 minutes of a day.
▶️ 100 million hours of video are watched on Facebook every day.
🧐 20% of people will read the text on a page, but 80% will watch a video.
💬 Nearly one in three e-commerce buyers say they chat with business in order to determine if they’re trustworthy and credible.
🔥 Omnichannel campaigns produce a 250% higher rate of purchase frequency than do single-channels campaigns.
Key Takeaways
It’s easy to get lost in the numbers and even easier to cherry-pick data points that prove your idea. However, even when putting this list together, we found several logically impossible statistics or directly contradicting ones. So what should you do with them?
As with everything, the most important aspect is to know your client. How do they behave? What challenges do they battle, and what is the best way to reach them and engage with them? That is where these statistics can come in handy. Whether you target Gen Z’s, Millennials, Baby Boomers or Screenagers/Alphas, reach out to them in the method most preferred by them.
Further reading: